! r4 S# m& _7 T- u+ B3 D/ a4 j. b
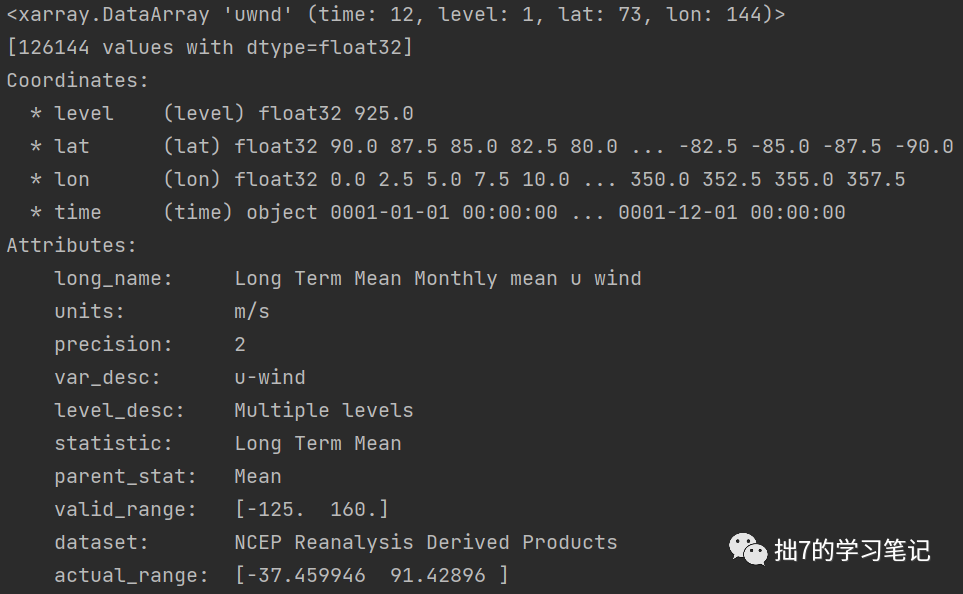
11.0pt;">气象数据常1 ]# F; E9 m1 D2 g( z" l- w$ T11.0pt;">以netcdf的形式存储,通常以hourly、daily、monthly、yearly等时间精度存储,但有时需要我们处理成月、年、季节、气候态等数据。因此在进行气象数据可视化前,需要运用xarray或者pandas进行数据处理。 (1)读取nc文件 import xarray as xruwnd = xr.open_dataset(r"C:/Users/lenovo/Desktop/mon-data/uwnd.mon.ltm.1991-2020.nc")['uwnd']print(uwnd)#查看其维度、刻度、变量等信息 (2)选取特定变量维度 #%%选取6-8月925hPa的纬向风uwnd=xr.open_dataset(r"C:/Users/lenovo/Desktop/mon-data/uwnd.mon.ltm.1991-2020.nc")['uwnd'].sel(level=[925])month=uwnd.time.dt.monthu=uwnd.sel(time=month.isin([6,7,8]))#%%选取某个月份数据ds.sel(time=month.isin([mon]),lon=slice(*lon_slice))[0]#%%【以下来自CSDN 努力努力再努力搬砖】#%选择特定时间、经纬度t=np.array(t2m.time.dt.month.isin([12,1,2]).loc['1979-12-01':'2020-03-01',850,50:30,110:130]).mean((1,2)).reshape(41,3).mean((1))#%提取季节数据和月数据等,以提取冬季数据为例t2m_winter1=t2m.loc[t2m.time.dt.month.isin([12,1,2])].loc['1992-12-01':'2021-03-01']t2m_winter2=t2m.loc[t2m.time.dt.season.isin(['DJF'])]t2m1=t2m.loc[t2m.time.dt.month.isin([12,1,2])].loc['1992-01-01':'1993-12-31',50:30,110:130]t2m1.mean(dim=['latitude', 'longitude']) #dim表示维度 (3)降维处理
以一个四维数据举例,该数据如下: import xarray as xruwnd=xr.open_dataset(r"C:/Users/lenovo/Desktop/mon-data/uwnd.mon.ltm.1991-2020.nc")['uwnd'].sel(level=[925])print(uwnd)

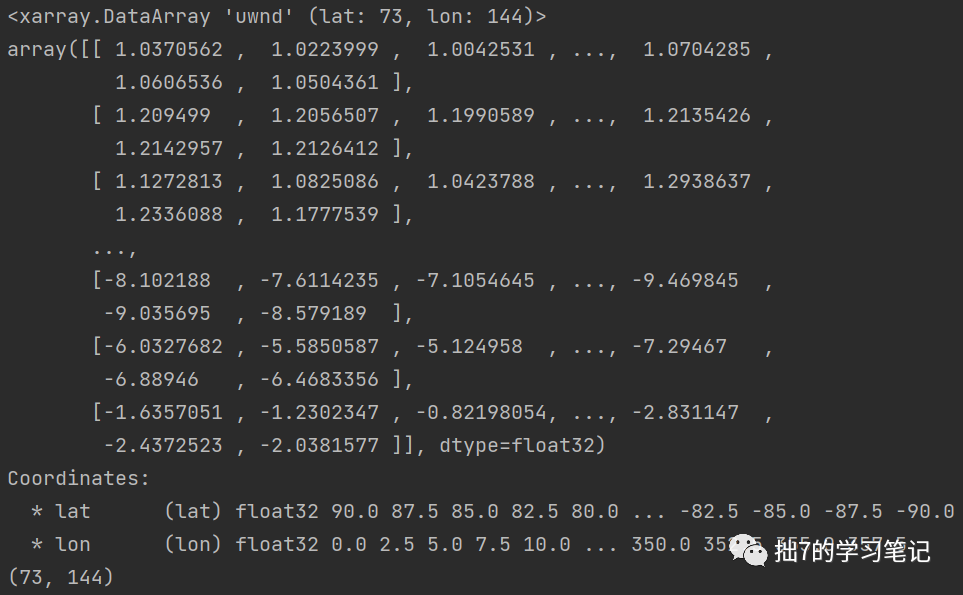
再查看一下它的维度排列顺序: #若在时间方向上以平均的方法进行降维,由维度排列顺序可知,时间索引为0u=uwnd.sel(time=month.isin([6,7,8])).mean(axis=0)#在气压、纬度、经度上依次是axis=1、2、3#若在时间方向上和气压方向上以平均的方法进行降维u=uwnd.sel(time=month.isin([6,7,8])).mean(axis=(0,1))#也可以采用xarray的方法,会自动跳过缺省值u=uwnd.sel(time=month.isin([6,7,8])).mean(dim='time')u=uwnd.sel(time=month.isin([6,7,8])).mean(dim=('time','level'))(12,
1 }) ?% \0 @0 E# K3 a1, 73, 144) 下面进行降维处理: u=uwnd.sel(time=month.isin([6,7,8])).mean(dim=('time','level'))print(u)print(u.shape)上述是用的平均的方式进行降维,此外如min(取最小值), max(取最大值), sum(求和), std(求标准差)等也可以实现降维。 降维处理在使用streamplot绘制流线时较必要,该函数需要传入二维数据。
(4)交换维度数据
以交换经度和维度数据为例,先看一下交换前的数据:
 使用 ds.transpose() 函数。直接在函数内传入所需要的顺序。eg:data.transpose('时间', '纬度', '经度')
说来好笑,我为什么会想要交换经纬度呢?因为我想要用streamplot绘制流线图。 然而streamplot函数内的参数是行数匹配Y的长度,列数匹配X的长度,我多此一举交换经纬度,然后美美报错ValueError: x and y( C% E2 [+ l* \# \( w: z" o8 Z
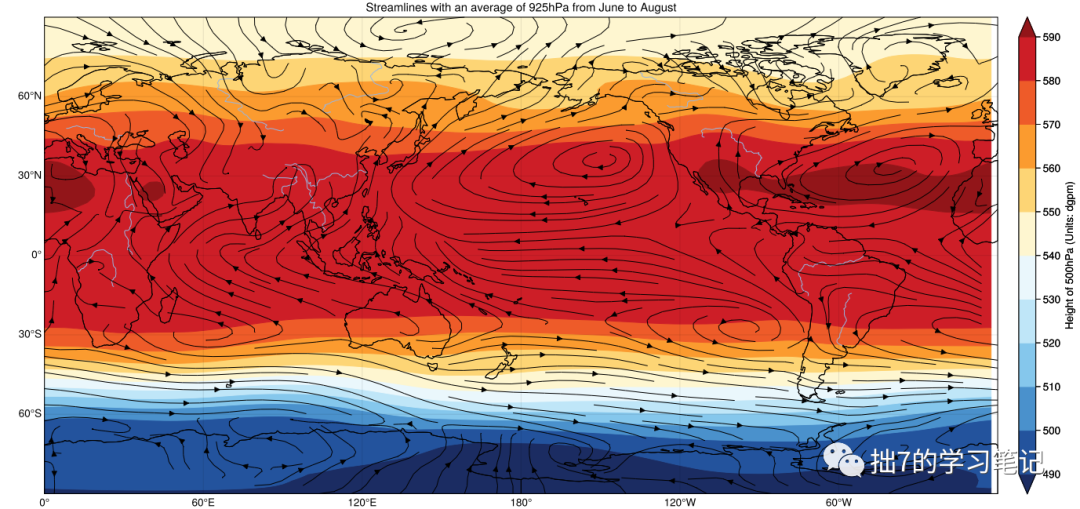
coordinates are not compatible with the shape of the vector components. (5)画布特定经纬度坐标设置 我使用proplot中的format()传入xlim=(0,360), ylim=(-90,90), ylocator=np.arange(90,-91,-30), xlocator=np.arange(0,361,30),无法间隔30°取点,暂时没理解原因。需添加数据循环防止白条出现。下图是我没有设置循环时的图,可见右侧出现白条。

注:个人自学记录,如有侵权,请联系修改或删除。
|